


Read story
Fore
From startup to IPO
Enterprise
Biteship Plus
Whatever your shipping and fulfillment requirements are, we create a custom solution for you. From specialized courier services to unique fulfillment options, Biteship Plus adapts to your goals, simplifying order-to-delivery for lower costs, greater efficiency, and superior customer experiences.

Start Created At
End Created At
These tables show delivery SLA performance by measuring how many orders arrived on time from pickup.
| courier_code | service_category | within_sla_ratio | total_delivered_orders |
|---|---|---|---|
| anteraja | regular | 100% | 5 |
| grab | same day | 100% | 12 |
| jne | regular | 100% | 472 |
| jne | next day | 100% | 60 |
| jnt | cargo | 96.4% | 28 |
Customer stories
From startup to IPO
Enterprise


From 1 pharmacy to 100 more
Healthcare


From Sprint to Marathon
Sportswear

From next day to same day
Retail
ERP integrations
From Oracle and SAP to Odoo, Q-ERP, and omnichannel OMS tools, connect orders, inventory, and shipping without replacing your enterprise stack.
All integrations







The challenge
Scale brings complexity: multi-outlet networks, SLA pressure, cost control, and teams across Ops, IT, Finance, and Support. Biteship Plus becomes your logistics arm, streamlining operations and cutting costs.
We make operations more efficient at scale while reducing operating costs, across store networks, courier aggregation, SLA, COD, and finance consolidation.
01
Track avg orders, cost, delivery time, and delay trends so capacity planning stays ahead of demand.
Avg. Orders per Day
183.25
Avg. Cost
Rp. 26.119
Avg. Delivery Time
63 Hours
Avg. Item Weight
1226.9 Gram
134 delayed shipments out of 5131 total
02
See how support tickets resolve across claim, oversla, stuck order, and tracking issues.
This chart shows the percentage of resolved tickets versus all tickets for each category.
This ratio is not used as an SLA reference. See average resolution days for SLA context.
Resolved Tickets Ratio per Category
⋯Resolved Tickets %
Ticket Category
03
Monitor resolution speed by category and courier against a 7-day SLA target.
This chart shows the average days needed to resolve a ticket for each category and courier.
Service Level Agreement (SLA)
SLA for average resolution days is resolved in less than 7 calendar days for all categories and couriers.
Avg Ticket Resolution Days - By Category and Courier
⋯Average Resolution Days
Ticket Category & Courier
04
Measure how fast non-instant couriers pick up after confirmation, H0 through H3.
This table tracks Pickup SLA by measuring how quickly couriers pick up orders after confirmation.
Cutoff Time Rules
The system compares order confirmation time against the cutoff time.
Orders Days to Pickup - Courier (Non Instant Services)
⋯| courier_code | total_picked_orders | h0_to_h3_pcg | h0_to_h3_count | h0_pcg | h0_count | h1_pcg |
|---|---|---|---|---|---|---|
| grab | 3 | 100% | 3 | 100% | 3 | 0% |
| sicepat | 18 | 100% | 18 | 94.44% | 17 | 5.56% |
| jne | 492 | 100% | 492 | 91.87% | 452 | 8.13% |
| sap | 25 | 100% | 25 | 88% | 22 | 12% |
| anteraja | 8 | 100% | 8 | 87.5% | 7 | 12.5% |
05
See what share of average order value goes to delivery cost, so shipping spend stays proportional to basket size.
Avg. AOV
Rp. 300.352
Avg. Delivery
Rp. 27.304
Delivery % of AOV
9.1%
Lower percentage means shipping cost stays efficient relative to order value.
06
Spot gaps between declared and actual weight or dimensions before invoice reconciliation. Couriers bill the higher of actual vs volumetric weight, so mismatches create silent surcharges.
Couriers charge the higher of actual vs volumetric weight. Gaps vs declared values create silent surcharges that surface at invoice reconciliation.
Avg. discrepancy
33.2%
Detected surcharge
Rp. 11.700
Billed vs declared gap by courier
⋯Relative scale per courier · max gap ≈ 75%
07
Cost per shipment ranked across 100+ stores. A leaderboard surfaces which stores quietly overspend on the same route and package profile, so HQ can unlock savings across the network.
Cost target ≈ Rp. 22.738 · stores above target miss savings opportunities
Store Jakarta Pusat
Rp. 18.000
Store Bandung Dago
Rp. 21.500
Store Surabaya Tunjungan
Rp. 25.000
Store Medan Center
Rp. 28.500
Store Bali Seminyak
Rp. 32.000
Store Makassar
Rp. 35.500
08
Percent of shipments booked through the official platform vs shadow bookings outside it. Low adoption means HQ has incomplete data and misses savings opportunities across the store network.
Via official platform
76%
Shadow bookings
24%
Low adoption = incomplete data and missed savings opportunities.
09
Late delivery and return-to-sender rates per store and region. Flags poor courier coverage or staff choosing the wrong service level, and protects brand consistency across stores.
Customers do not distinguish store A from store B — weak SLA hurts the brand.
10
Decentralized handling creates more surface area for cash discrepancies. Store-level COD reconciliation matters more here than in a centralized warehouse model.
More cash-discrepancy surface area than a centralized warehouse model.
Gap
Rp. 3.779.000
| Store | Collected | Remitted | Gap % |
|---|---|---|---|
| Jakarta Pusat | Rp. 74.000.000 | Rp. 73.408.000 | 0.8% |
| Bandung Dago | Rp. 24.000.000 | Rp. 23.904.000 | 0.4% |
| Surabaya Tunjungan | Rp. 78.000.000 | Rp. 75.972.000 | 2.6% |
| Medan Center | Rp. 72.000.000 | Rp. 71.352.000 | 0.9% |
| Bali Seminyak | Rp. 83.000.000 | Rp. 82.585.000 | 0.5% |
11
Unusual patterns per store, spikes in returns, suspiciously high express usage, or self-shipping to fake addresses, that one dashboard can catch but individual store managers cannot.
Bandung Dago · Return spike
+210% RTS vs 4-week avg
Medan Center · Express overuse
48% instant on local SKUs
Semarang · Suspicious address
12 self-ships to same block
Makassar · Cost outlier
Same route +62% vs peers
12
One combined finance view instead of reconciling 100+ separate courier bills across stores.
Invoices combined
329
instead of 100+ separate bills
Period total
Rp. 1.257.000.000
Consolidated finance view
| Courier | Invoices | Amount | Status |
|---|---|---|---|
| jne | 118 | Rp. 482.000.000 | Matched |
| jnt | 96 | Rp. 391.000.000 | Matched |
| sicepat | 74 | Rp. 256.000.000 | Review |
| sap | 41 | Rp. 128.000.000 | Open |
What you see above is just a preview. On the enterprise plan, Ops and Finance get more performance views across multi-store networks, from savings to anomaly alerts.
Preview unlock
12+ analytics modules
Talk through your multi-store needs with sales
Reduce cost & improve SLA
Cover the full order journey, from pre-checkout stock to returns, so every stage reduces cost and improves SLA.
Think of us as your logistics arm, pairing your Ops, IT, Finance, Support, and Marketing teams with dedicated Biteship specialists.
Work with Biteship IT for product development, feature requests, and logistics-related man-days.
Biteship-run control tower oversight to keep dispatch, exceptions, and SLAs under watch.
A dedicated ops manager focused on reducing cost and improving delivery performance.
Headless UI components wired into your own dashboard, plus custom APIs tailored to business needs.
Management fleet and route planning tools in the dashboard for hub and network operations.
User access management by role, plus optional in-office installation with product customization.
Retail and multi-outlet brands use Biteship Plus to run pick, pack, QC, and shipping from fulfillment centers built for scale.
From picker drop racks to packing stations, Biteship fulfillment teams handle multi-outlet volume with strict SLAs.
Enterprise fulfillment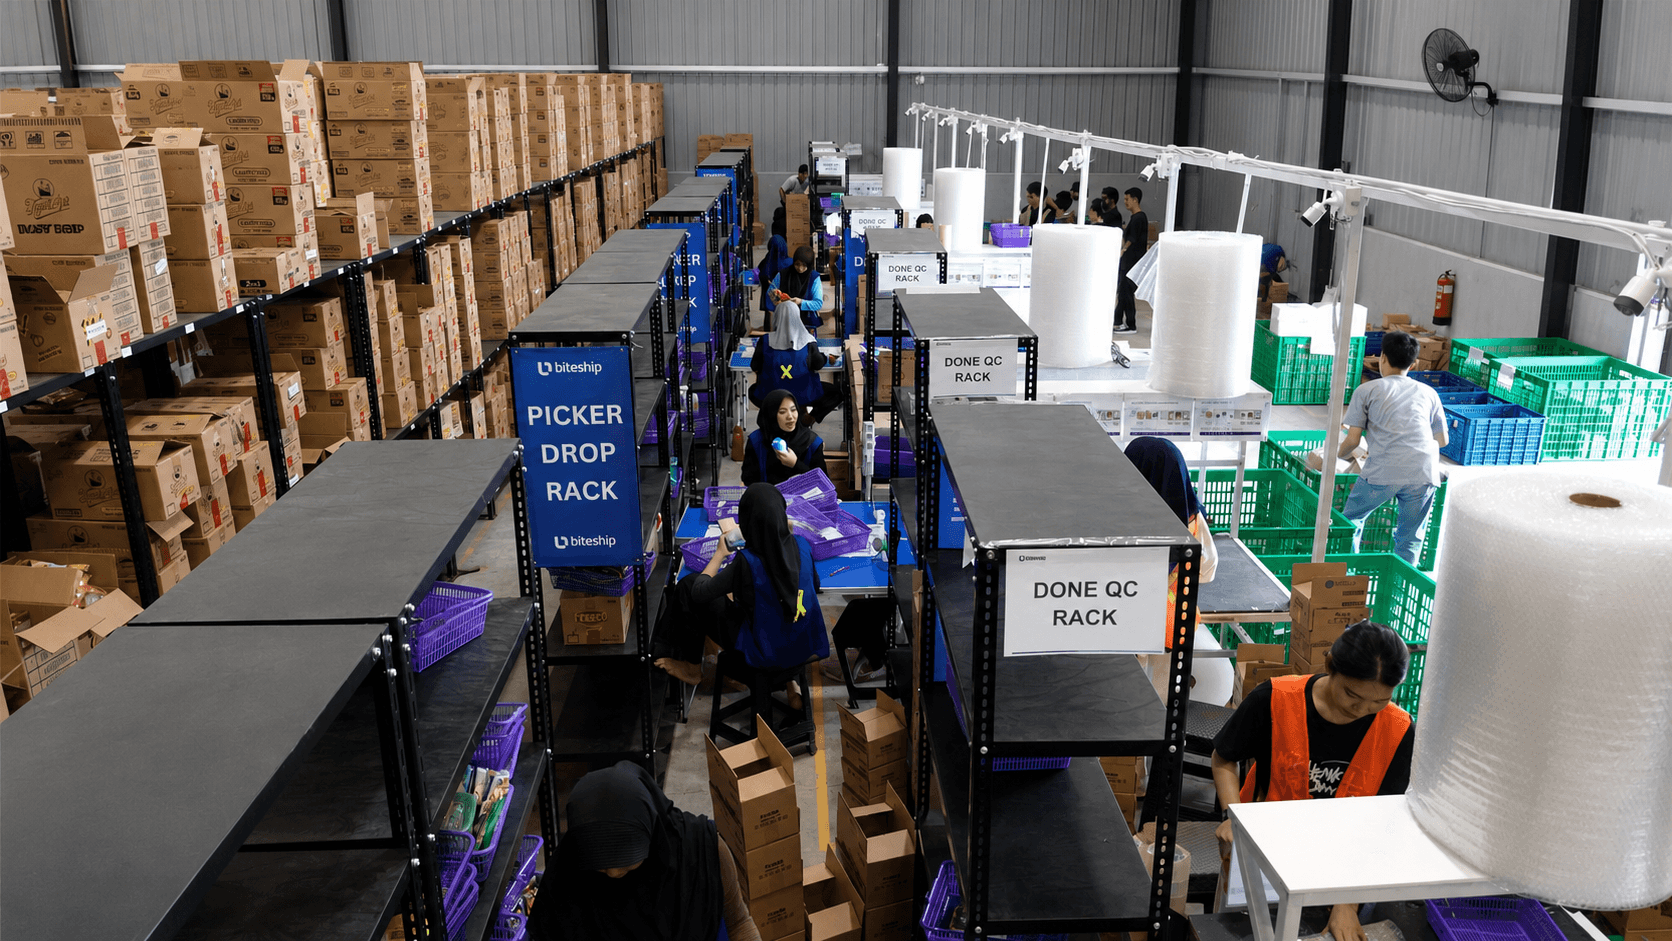
Key highlights
Move to Plus when you need own fleet, dedicated support, and deep customization.
| Features | Biteship | Biteship Plus |
|---|---|---|
| Courier management | Managed courier network | + Own fleet or outsourced couriers with your agreements |
| Couriers option | 35+ couriers: Instant, Same Day, Regular, and more | + Access to 500+ courier marketplace with own rates |
| Monitoring | Ticket system in Biteship dashboard | + Dedicated ops manager & customer support team |
| Integration | Simple, comprehensive, readable API docs | + Extra IT man-days for logistics-related improvements |
| Dashboard | Biteship dashboard as standard ops | + Headless UI components in your own dashboard |
| Additional features | Core shipping & fulfillment suite | + Custom features, role-based UAM, in-office install & customization |
How we help
Faster, more reliable service while reducing delivery costs for end buyers.
Scale pharmacy outlets and reduce delivery fees, cost-effective, reliable care for patients.
Boost mobile app order adoption with flexible, reliable shipping options.
In today’s world, shipping is not only about delivery, it is also about code.
What to expect?
Not one-off projects, we become an extension of your team and evolve with your growth.
From integration to execution, every milestone and challenge is tackled together.
As your brand grows, our platform adapts, network expansion or tailored shipping processes.
Tech integration to final delivery, every component aligned to your operational goals.
We refine services continuously so your logistics stay ready for tomorrow’s ecommerce.
Shipping is also about code, smart, tech-driven solutions for complex logistics challenges.
01/03
99.999%
historical uptime for Biteship API

Become a long-term partner. We’ll map control tower, courier allocation, and custom integrations to your operating model.

Logistics ecosystem to grow your e-commerce business, from shipping aggregators to fulfillment warehouses.
Services
© 2026 Biteship. All rights reserved.